Add a Chart Widget
Charts visually represent your data. This widget displays a chart based on queries created in the Query Editor.
|
|
 PREREQUISITES:
- Click Dashboard.
- Click
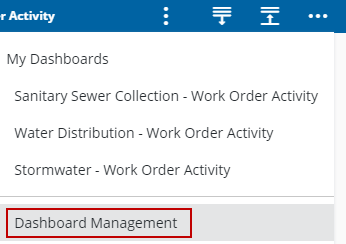
 NOTE: The most-recently-viewed dashboards display. To quickly switch between recently-viewed dashboards, see Switch Between Dashboards for more information.
The Dashboard Management page opens.
- Click the edit icon in the Dashboards panel.
- On the Dashboard - Edit page, click the add icon.
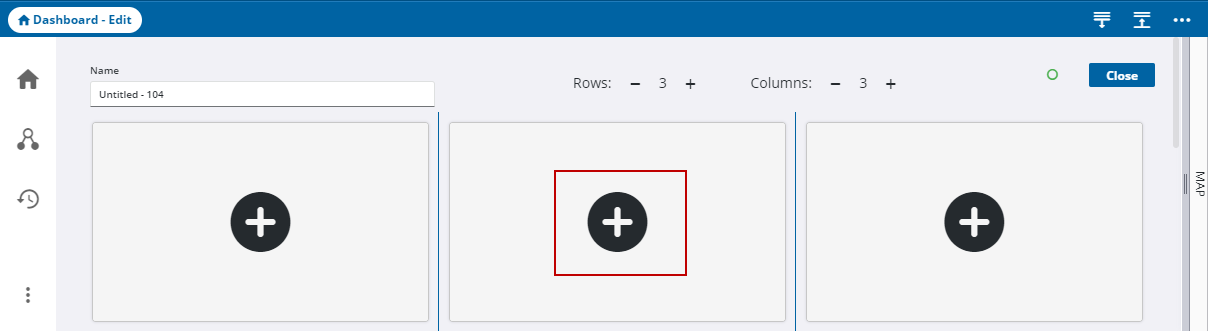
The Add Widget panel opens.
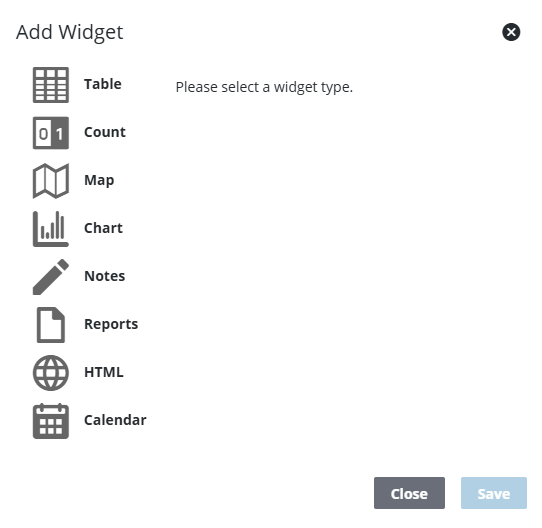
- Select Chart.
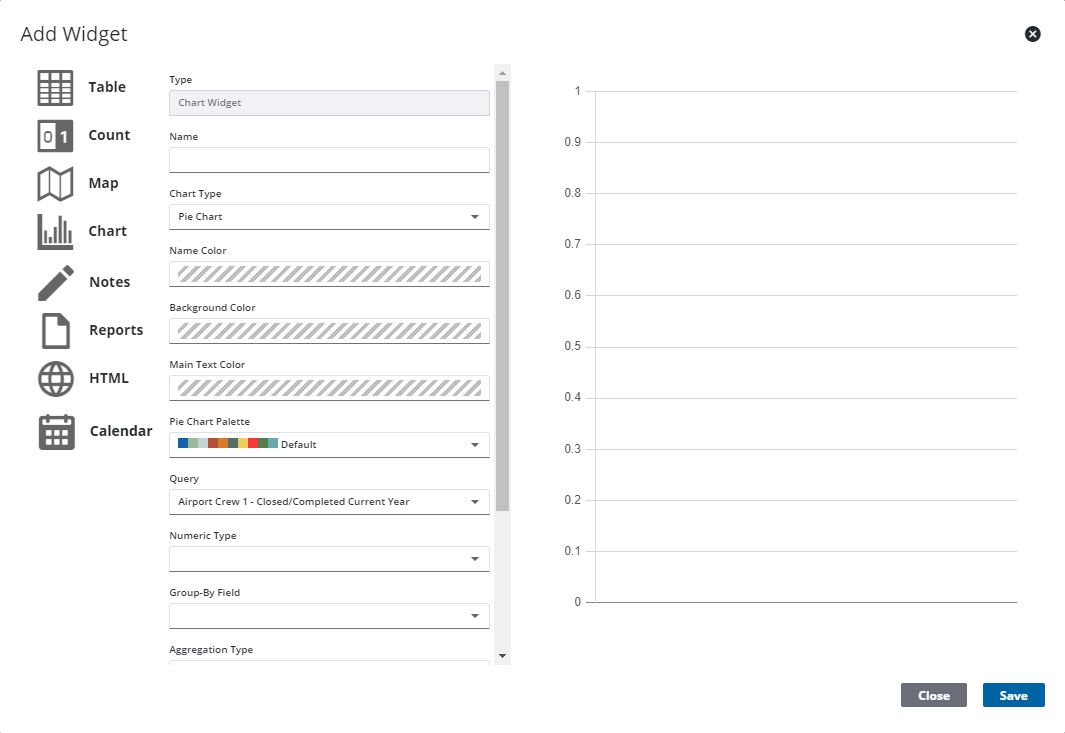
NOTE: A preview appears to the right on the Add Widget panel that dynamically changes as you define fields for the widget.
- Enter the Name.
- Select the Chart Type.
- Select the Name Color, Background Color, and Chart Color.
- Select the Main Text Color or the Pie Chart Palette, depending on which Chart Type you selected.
- Select the Query.
- Select the Numeric Type.
- Select the Group-By Field to determine how to group the results on the x-axis, and Group-By Date Range if applicable.
- Select the Aggregation Type and Aggregate-By Field if applicable.
- Select an action.
NOTE: See Query Action Types for more information on query actions.
- Click Save.