View Asset Curves and Details
You can view asset curves and their details based on an existing calculation search.
 TIP: You can filter the list of records displayed. See Filter Records for more information.
- Perform a search. See Perform a Calculation Search for more information.
The Search Results panel populates.
- From the Search Results panel, click the Curve icon on any asset to populate the Asset Curve and Asset Details panels.
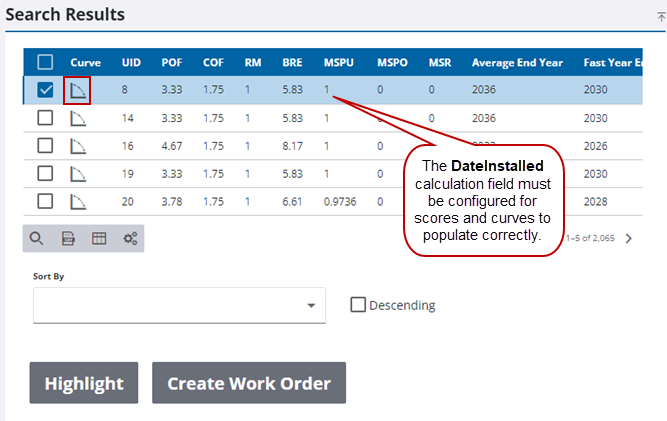
 IMPORTANT: The DateInstalled calculation field must be configured with the correct GIS field for the asset scores and asset curve to populate correctly. See GIS Field Mapping for more information.
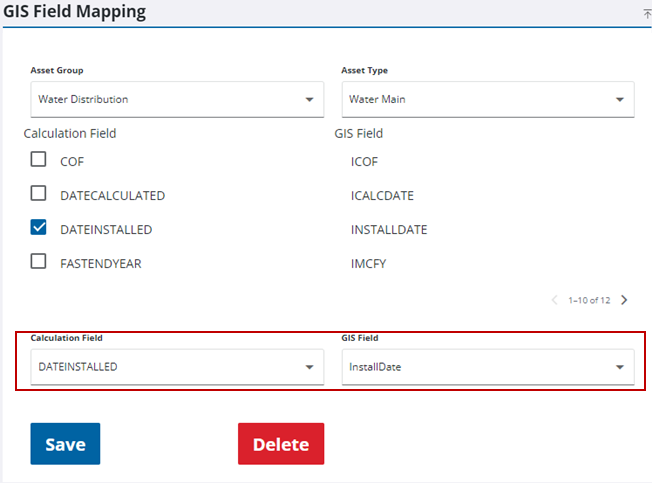
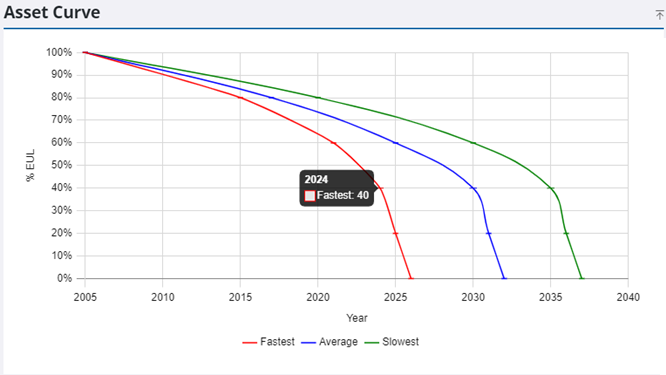
- In the Asset Curve panel, hover over an intersection of a curve to see more information. The X-axis shows the year, and the Y-axis shows the %EUL.
- In the Asset Details panel, select Attribute, Inspection, or Work Order from the Detail Type drop-down list. Only work orders and inspections that are after the installation date appear in the list.
TIP: You can filter the list of records displayed. See Filter Records for more information.
When Attribute is selected, the asset attributes are listed.
For inspections and work orders, the filtered list shows the asset Id, Description, Status, Cost, Hours, Start Date, and Finish Date. The Total Cost and Total Hours are displayed for inspections and work orders.
 NOTE: The Asset Details panel shows work orders and inspections that were performed past the installation date.
- From the Search Results panel, click Create Work Order to create a work order from the selected search results. See Create a Work Order or Inspection for more information.
- Click Highlight to highlight calculation search results on the map.